

Losing weight for good It keeps changing, just tell me what I should eat!

Enduring weight loss: a victory indeed
Setting the scene
Without pharmacological or surgical assistance, sustained weight loss is notoriously difficult. A typical weight loss pattern entails a loss of up to 10%, achieved within six to nine months. Sadly, a year later, half these losses have been regained, and after four to five years, nearly all of it has. On the upside, whatever losses are retained by this point are often maintained for good. (Ref, Ref, Ref, Ref, Ref) And these dispiriting results may oversell the reality as 1) most research is in very overweight subjects, while those with lower initial weights failed to maintain losses beyond a year (Ref); 2) some study drop-out rates were up to 40% (Ref); and 3) the bar for success may seem low, being, almost always, a loss of 10% maintained for a year.
It's really no surprise that enduring weight loss is hard. Humans are designed to guard against the smallest hint of starvation with an astonishing array of physiological mechanisms, which simultaneoulsy slow metabolism and drive hunger. (Ref)
In this article we suggested that, given the long odds and psychological costs, concentrating on something other than weight loss might be warranted. But if you enjoy a challenge or feel the benefits are worth the work, then the next four articles in the series will tell you where to direct your efforts. This article will cover what to eat.
There is now a deep and broad body of research on weight loss, with one interesting data source being The National Weight Control Registry (NWCR), a U.S. database of >10,000 adults who have maintained significant long-term (average 5.5y) weight loss (average 66 lbs [29.9kg]) and, in most cases, without weight-loss medication. It’s a testament to the possibility of enduring weight loss but also a great example of survivorship bias, so we can’t say the strategies employed are infallible. However, it does tell us what wasn’t required to succeed and suggests where to concentrate our energies. Of course, it has been picked over extensively for such intelligence!
The overarching theme emerging from this research is the centrality of calorie reduction, with the recurring sticking point being dietary adherence, which appears to be best negotiated by lowering calorie density as much as possible without foregoing satiety. Below are the main factors associated with marrying these two objectives. But before we get into it, to put this advice into practice would require calorie, macronutrient (carbohydrates, protein and fat) and fibre counting at least for a few days. There are several apps which do this, with Cronometer or My Fitness Pal two good options. The free basic versions can both calculate calorie needs for maintenance as well as for various rates of weight loss (based on your age, weight, height, sex and physical activity level) and both report macronutrients along with seval other nutrients, including fibre.
Tell me about protein first please?
Yes, protein does seem to dominate the discussion, doesn’t it? Weight loss will occur equally efficiently with any macronutrient combination as long as there’s a calorie deficit, but protein has the edge for satiety, explaining why higher protein diets foster better adherence. (Ref, Ref, Ref, Ref) What constitutes high protein? Typically, 1.2 to 1.6g/kg/d, with roughly a third per meal. Other research suggests there are appetite management benefits when protein is included at up to 20% of total calories, but little beyond that. (Ref) Australian population surveys suggest this is an achievable target, as average current protein intakes are not too far off, as you can see in the table below. (Ref, Ref) This is fortunate, as materially changing dietary macronutrient composition for any length of time is quite hard to do. (Ref, Ref) As for the NWCR’s successful weight loss maintainers, one study in 3,338 members found protein made up, on average, 19% of their energy intakes, though members, at least in this study, were only consuming 0.92 g/kg body weight. (Ref)
| Australian adult protein intake | Men | Women |
|---|---|---|
| Weight (kg) | 84 | 70 |
| Protein (g/d) | 103 | 79 |
| Protein (g/kg/d) | 1.2 | 1.1 |
| Energy (calories/day) | 2193 | 1722 |
| Protein (% energy) | 19 | 18 |
Data source: Australian Bureau of Statistics, National Nutrition and Physical Activity Survey (2023) and National Health Survey (2022) (Ref, Ref); *likely underreported by about 23%. *likely underreported by about 23%. (Ref)
When thinking of protein, meat might be the first thing that springs to mind but plant-based sources are a better option as they offer better protection against chronic disease. (Ref) Which brings us to…
Fibre
One of the many benefits of eating more plants is their fibre content, a nutrient where Western populations invariably fall short. For instance, Australian men and women consume 22 and 19 g/d respectively, compared to the recommended 30 and 25 g, which is likely also suboptimal. (Ref, Ref)
A wealth of observational data consistently supports the benefits of fibre for weight management. In one cohort study, over four years, for each 10 g/day increase in total dietary fibre, weight gain was reduced by 0.8 kg. Fibre from fruit and vegetables appeared the most effective; followed by pulses (chickpeas, lentils, soybeans etc – a great source of plant protein); and then whole grains. (Ref)
How does fibre help? How doesn’t it? Soluble fibre forms a gel in the small intestine which slows digestion to improve satiety and smooth blood glucose; fibre’s also not completely digestable, meaning calories per gram are about half those of other carbohydrate; while insoluble fibre can shield other calories from digestion; chewing slows down eating rate to regulate food intake; and, finally, in the large intestine, fibre fermentation may promote less obesogenic gut bacteria. (Ref)
Yet, despite its many purported actions, one older NWCR study found members only consumed an average 17 g/d of fibre. (Ref) So if you can’t handle too much or some types of fibre, it’s not an insurmountable barrier to weight loss.
And what about water?
Like fibre, water reduces calorie density. By lowering calories per bite, satiety signals have a chance to reach the brain before you eat too much. Of course, there’s a limit to how low a meal’s calorie density can go before it’s just not satisfying. A bowl-full of salty water or iceberg lettuce can technically fill you up but you also need sufficient macronutrients to activate the various hormonal cascades that lead to satiety. (Ref) As an entrée though, a low-calorie soup or salad can take the edge off your appetite and has been shown to reduce total meal calories by up to 20%. (Ref, Ref)
There’s another way soup, in particular, can help with satiety. The mechanism is best explained by its opposite: “the buffet effect”, where you eat more because variety keeps the reward per bite high enough to keep you eating. Dessert anyone? But with our soup, reward drops with each identical mouthful and, as the volume is relatively large, reward may drop below willingness to continue eating. (Ref)

A low-calorie soup as an entree or the main meal can help manage your appetite and reduce calorie intake.
4. Fat… isn’t fat okay now?
Here’s a contentious one, but despite a good PR campaign, in interventional trials, lower fat diets delivered greater weight loss over time in men and women. (Ref, Ref) This is likely because fat has double the calories of carbohydrates or protein and energy density is associated with weight gain (See this article). Gram for gram therefore, fat is less satiating than other macronutrients. (Ref) The other, patently clear feature is that fat makes food moreish and, as research demonstrates, compared to a bland meal, subjects might eat nearly 50% more when the food is tasty – so more volume and more calories per bite. (Ref) This is doubtless one reason for the inclusion of fat in many commercial foods: to drive demand and override physiological appetite signals. Given this, it’s perhaps not surprising that people have difficulty sticking to a low-fat diet, so there are practical limitations to such advice. (Ref, Ref) One study suggested a diet targeting 30% of calories from fat was superior to 20% for weight loss, perhaps as the higher fat diet was not entirely devoid of joy, resulting in better adherence. (Ref) In the same NWCR study cited above (n=3338), fat comprised 29% of energy intake (Ref), while Australian men and women consume 33% and 34% of their calories as fat, respectively, suggesting a reduction of less than 5% of calories from fat could yield results. (Ref) However, as they had lower calorie intakes, the NWCR members’ absolute fat intakes, at 47 g/day, were less than two-thirds of Australians’ daily intakes, presenting more of a challenge.
| Australian adult fat intake | Men | Women |
|---|---|---|
| Fat (g/d) | 81 | 65 |
| Energy* (calories/d) | 2193 | 1722 |
| Fat (% energy) | 33% | 34% |
Data source: Australian Bureau of Statistics, National Nutrition and Physical Activity Survey (2023) (Ref); *likely underreported by about 23%. (Ref)
5. Carbohydrates
Deriving 20 and 30% of energy from protein and fat, suggests about half of calories should come from carbohydrates. In reality, Australians consume a little less, due to higher fat intakes and, of course, alcohol.
| Australian adult macro breakdown | Men | Women |
|---|---|---|
| Protein | 19% | 18% |
| Fat | 33% | 34% |
| Carbohydrates | 45% | 46% |
| Alcohol | 3% | 2% |
Data source: Australian Bureau of Statistics, National Nutrition and Physical Activity Survey (2023), and National Health Survey (2022). (Ref)
Carbohydrates come in various forms and form matters. About 60% of calories are starches; some 35% are sugars (split about 50/50 between intrinsic and added sugars) and a few percent is fibre, which we’ve already discussed. There are also several other minor players.
Starch
Starch is the main dietary source of blood glucose but not all starches are created equal. Compared to rapidly digested starches, for instance white flour, digestive enzymes have less access to the constituent glucose molecules in slowly digested starches, either due to accompanying fibre restricting access, or due to the structure of the starch molecule itself. Consequently, slowly digested starches break down more slowly, resulting in longer-lasting satiety. Any remaining slowly digested starch not digested in the small intestine is termed resistant starch. It can be thought of as a type of fibre as, like fibre, it can be fermented by the gut microbiota in the large intestine. (Ref) The schema below outlines the different types of resistant starch. (Ref)

Slowly digested starch becomes resistant starch (RS) when not fully digested in the small intestine. (Ref)
I quit sugar! But why would you?
Despite febrile debate, there is scant evidence that sugar calories per se are uniquely fattening, so there’s no need to be obsessive about it.
However, just like fat, sugar tastes good (one good reason not to be absolutely hardline!) so can drive consumption beyond normal appetite cues. Moreover, sugar raises blood glucose, which triggers insulin release, rapid clearance of glucose from the blood, and may cause subsequent hypoglycaemia and hunger. (Ref) This interference with appetite regulation means that, though the effect is relatively minor, reducing sugar is generally accompanied by reduced body weight, while the converse is also true. (Ref)
Amongst sugary choices, the most well studied and possibly pernicious actor appears to be sugar-sweetened beverages, or SSBs (soft drinks and juices). The linear association between SSB consumption and body weight has been demonstrated in many studies and this is likely because calories that are drunk rather than eaten have less effect on satiety; (Ref) while the rapid ingestion of a large sugar load, overwhelms the body’s ability to manage it by normal mechanisms. (Ref)
A dude at the gym said keto is the only way…
No discussion of carbohydrates would be complete without mentioning the ketogenic diet, a diet that generates particular fervour in some circles and is the subject of more biased research papers than most nutrition subjects. By definition, the diet is very low in carbohydrates (<50 g/day), forcing the body to rely on fat for energy, the breakdown of which produces ketosis. These diets are usually high-fat, hence endogenous body fat is not necessarily an energy source, but, as ketosis has appetite suppressive effects, food intake can fall and thus deliver weight loss by the usual means of calorie deficit. (Ref)
With a ketogenic diet, weight loss can be initially rapid but one tightly controlled trial found that, while weight loss over two weeks with the ketogenic diet exceeded that of a comparator low-fat diet (matched for protein), almost none of this was fat. (Ref)

The ketogenic diet (LC) saw more weight loss, but less fat loss, than a low fat (LF) diet over two weeks. (Ref)
And longer term, a ketogenic diet has proven no more successful than those who follow other diets, likely because, once again, adherence falls away with time – it really is not easy to manipulate macro ranges very much! (Ref) There are also a number of potentially serious possible draw backs (particularly when animal foods predominate), including high cholesterol, pancreatitis, loss of bone mineral density and kidney damage. (Ref) In fact, chronic low carbohydrate intake is associated with reduced lifespan. (Ref)
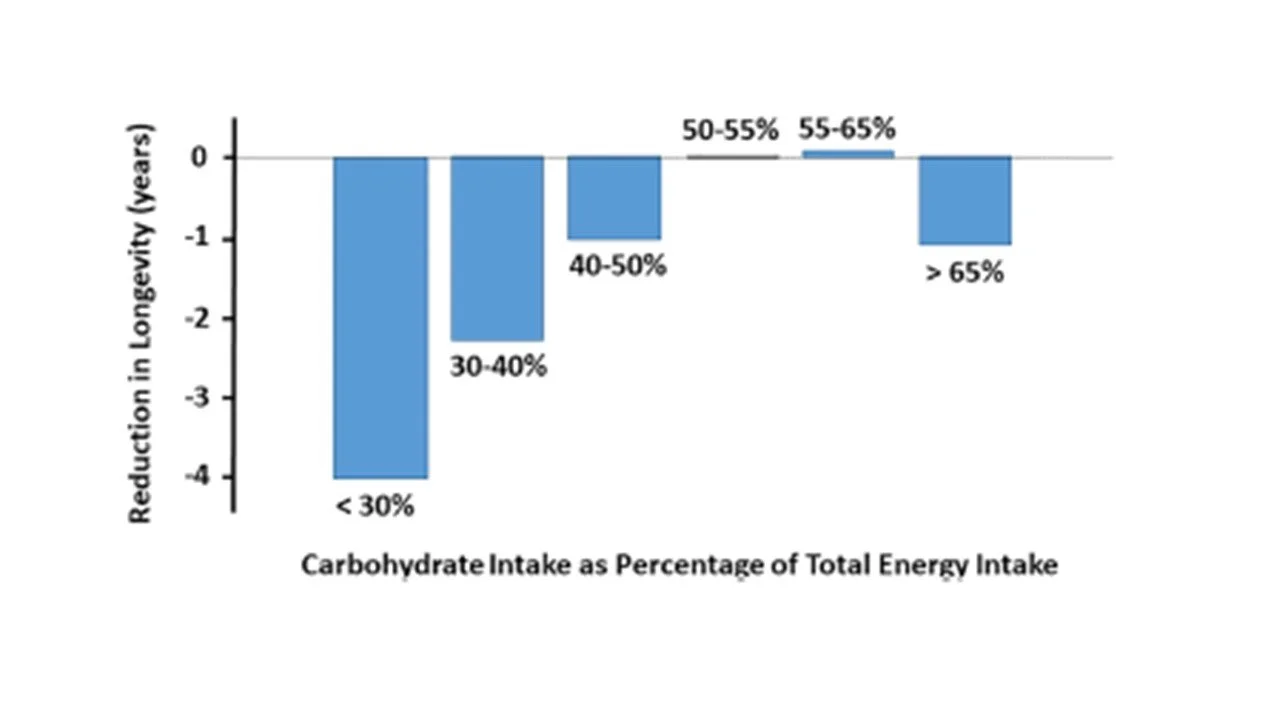
Low carbohydrate intake (and high intakes too) reduce life span. (Ref)
Putting it all together
Back in 1995, a group of researchers produced a satiety index of common foods, based on ingestion of 1000kJ (239cal) – a substantial snack size. Their results, in the scanned chart below, demonstrate many of the factors we’ve discussed. (Ref) The top two categories are high in simple starches (white flour) and sugar, respectively, while also being calorically dense. Therefore, per calorie, they were less satiating. The cereals are a mixed bag. The muesli, while containing ample fibre, contained calorically-dense dried fruit, which would have reduced the portion size. However, oats scored well, perhaps as they are high in satiety-inducing soluble fibre and included added water. Also satisfying were the protein foods, though only fish matched oats for satiety. This might be down to a higher fat content (the lentils were also cooked with oil) in the other protein foods, reducing portion size per 1000kJ. Within the carbohydrate-rich foods, the standout was boiled potatoes – Note though, that these were cooked the day before so these potatoes would have been high in resistant starch. (Ref) Nevertheless, other studies have also found potatoes to be more satiating than pasta or rice, which may be due to their higher water content and fibrous skin. (Ref) Finally, amongst fruits, apples and oranges, with high levels of intrinsic water and fibre, despite also containing natural sugars, compared well for satiety.

A satiety index of common foods rated per 1000 kilojoules. Source: Holt et al (1995). (Ref)
These are the most evidence backed food intake strategies for weight loss. The next article in the series will cover the science behind the way of eating and weight loss. One final comment: please remember that there are billions of people on the planet, so of course there is considerable genetic variability between us.

A species which has survived in many different environments (even one less unnaturally selected than our friends above) will inevitably have a lot of genetic diversity.
It’s always wise to assume you’re close to average as your starting point, but inevitably some strategies may not be particularly feasible or effective for you. But the only way to know for sure is by giving them a go.