
Your frenemy alcohol

Would it be as fun without the drink?
The festive season is on us, which is a significant religious holiday of course. But also: bottoms up! In December, Australians drink 70% more than the their average intake over the other 11 months of the year. And the rest of the Summer (and most of Autumn) is one long jolly as well, with relative rectitude not returning until May. (Ref) Like many of life’s pleasures, drinking does not always produce long-term unalloyed joy and many people wonder whether they can even have fun at a party, or relax after work without a drink to smooth the edges, perhaps explaining the advent of Febfast! Dry July! Octsober! When a public commitment is made to abstain, and fewer questions asked. We know heavy drinking is unwise but what are the health effects of light drinking? And are they the same for everyone? Let’s find out.
How alcoholic is my drink?
In Australia, a standard drink is 10g of ethanol (for our purposes, ethanol = alcohol). Confusingly, it’s 8g in the UK and 14g in the US.
How much is 10g? That, of course, depends on the strength of your drink. Alcohol by Volume (ABV) is the percentage of a drink that’s alcohol and you’ll find it on the label. A 750ml bottle of wine with 13.5% ABV, has 8 standard drinks per bottle, and therefore, 94ml (750ml/8) per standard drink. That’s about as much as the lady has in her glass in the photo above. Not so much, really.
Here’s your drink size with different ABVs.
| ABV | 2 | 4 | 6 | 8 | 10 | 12 | 14 | 16 | 20 | 30 | 40 |
|---|---|---|---|---|---|---|---|---|---|---|---|
| 1 SD | 634 | 317 | 211 | 158 | 127 | 106 | 911 | 79 | 63 | 42 | 32 |
Here’s the thing: 13.5% is pretty typical for Australian wine (it’s to do with the warm climate making more sugars in the grapes). And it’s my long-standing observation that there are about four-and-a-half glasses of wine in a bottle, based on common pour size, implying 167 ml per (non-standard) drink. Using our 13.5% ABV wine above, a 167ml non-standard drink = 1.8 standard drinks. Good to know.
How much can I drink before I tip into risky territory?
Australia’s alcohol guidelines now explicitly state that the less you drink the lower the risk of harm and this is supported by an abundance of population data showing that overall heath and injury risks rise from the first drink, at least until late middle age, when things get less clear. (Ref, Ref)
But at low levels, these harms are minimal. Thus, the guidelines advise limiting intake to no more than 10 standard drinks in a week and no more than 4 standard drinks on a single day (and advise against any alcohol for minors, pregnant or breastfeeding women – but you knew that already). (Ref)
Hence, we can have a little over 2.2 of our-nonstandard drinks and we’re done for the day and over the week, 5.5 glasses of our non-standard drink is the limit, based on the guidelines.
It may seem counterintuitive that the same limits are advised for both men and women as, even matched for size, which they rarely are, women absorb alcohol more quickly and attain a higher blood alcohol than men, after drinking the same amount. At 4 drinks/day or 10 a week though, the difference in risk is negligible. While at higher intakes, yes, women are more somewhat more susceptible to chronic disease impacts, but men of all ages are more at risk of traumatic injury. (Ref)
In fact, about a third of Australian adults habitually drink above these limits with men consistently more likely to drink to excess in all age groups and more likely to have alcohol use disorder (Australian men: 6.1%, Australian women: 2.7%). This is a pattern observable globally and one wonders whether this is cultural or genetic.

Men are riskier drinkers than women worldwide. (Ref)

Australian risky drinking by men and women aged 14 years and over. (Ref)
In a pattern that may sound familiar, binge drinking is most common in young adults while weekly intakes are highest in mid-life. Young adults are of particular concern because the combination of relative immaturity and alcohol sets the scene for traumatic injuries, which can cut short or change the course of a young life which should have decades of healthy runway ahead of it. While in mid-life, the many stresses and societal norms that abound at this age, see lifestyle habits begin to bite and the risks of chronic disease rise.

Australian adults exceeding Australian advised alcohol intakes by age-group. Source: Australian Guidelines to Reduce Health Risks from Drinking Alcohol. National Health and Medical Research Council (2020). (Ref)
The journey of alcohol in the body
After you swallow your alcoholic drink, it makes its way to your stomach where the enzyme alcohol dehydrogenase (ADH) starts to break it down. Women have less gastric ADH than men and thus a greater proportion of ingested alcohol goes on to be absorbed in the intestine. Post absorption, alcohol is delivered to the liver, which has its own ADH and gets to work metabolising some more of the alcohol. In all, a quarter to nearly half of ingested alcohol is metabolised at least partially in the stomach or the liver before it has a chance to circulate throughout the body in a process called “first pass metabolism”. (Ref)
Factors which increase first pass metabolism (and reduce blood alcohol)
Larger liver size
Co-ingestion of other calories
Higher ABV
Drugs than delay gastric emptying (GLP-1 agonists)
Breastfeeding
Factors which reduce first pass metabolism (and increase blood alcohol)
Female sex
Carbon dioxide (champagne)
Weight-reduction gastric surgery
Alcohol use disorder (AUD)
Passing out of the liver, the remaining alcohol circulates throughout the body and diffuses into cells in proportion to their water content. Fat is low in water, so absorbs minimal alcohol. This is another reason women matched for size will have a higher blood alcohol than men for a given volume of alcohol. Likewise, age reduces lean mass in favour of fat mass and increases blood alcohol, all else being equal.
ADH is present in a number of body organs, so the alcohol is metabolised on its journey throughout the body and a further 2-10% is excreted as alcohol in sweat, expired air and urine. Otherwise, it will be progressively diminished as it circulates back through the liver.
This path accounts for 90% of alcohol metabolism. There is an alternative pathway, the Microsomal Ethanol Oxidizing System (MEOS) that kicks into gear with binge drinking as well as in chronic drinkers, where it can account for up to 30% of alcohol metabolism. The MEOS pathway generates significant reactive oxygen species (ROS) (the artist previously known as free radicals), explaining why binge-drinking is particularly harmful.
These pathways metabolise alcohol to acetaldehyde, which is toxic and, while ethanol is also detrimental to healthy cell functioning, acetaldehyde is responsible for most of alcohol’s chronic health effects. (Ref, Ref)
Acetaldehyde is usually quickly dealt in the liver by the enzyme acetaldehyde dehydrogenase (ALDH), producing acetate, which provides energy and the source of alcohol’s 29kJ/g. (Ref) An exception to rapid acetaldehyde breakdown, lies in people, commonly of East Asian descent, who frequently have a variant in the ALDH enzyme, which dramatically slows the rate of acetaldehyde breakdown and can cause a reaction unpleasant enough to discourage drinking. Consequently, people with these variants are much less likely to drink excessively or become dependent. (Ref, Ref) *
In addition to 1. interference in cellular processes by ethanol; 2. damage from acetaldehyde; and 3. MEOS-derived reactive oxygen species; 4. oxidised nicotinamide adenine dinucleotide (NAD+) is driven down, which leaves the cells (especially in the liver) further vulnerable to oxidative damage from free radicals and acetaldehyde. (Ref, Ref) These four processes account for most of the harms from alcohol consumption.

Ethanol is converted to acetaldehyde and then to acetate. Data Source: (Ref)
*Other gene variants promote dependency, explaining why susceptibility to alcohol use disorder (AUD) appears to be an inherited trait, though not isolated to a single gene. (Ref) Fascinatingly, the glucagon-like peptide receptor agonist (GLP-1 RA) drugs, such as Ozempic and Mounjaro, have demonstrated effectiveness in curbing the urge to drink in people with AUD and may curb other addictive behaviors as well. This is an area of intense interest currently and may have further implications for society. (Ref, Ref)
How long does this all take?
Within five minutes, alcohol starts to affect the brain. Blood alcohol peaks about 30–45 minutes after drinking one standard drink. As ADH is saturated by less than one standard drink and can only process about 7.5g/hour of alcohol (three-quarters of a standard drink), blood alcohol will continue to rise if you drink at a faster rate than this. Any factor that increases first pass metabolism will lower blood alcohol as will blood volume, liver size and lean body mass. (Ref)
Alcohol health effects
Alcohol is a major contributor to cancers, especially of the gastrointestinal tract, liver and breast; liver disease, cardiovascular disease; neurological conditions; and, of course, traumatic injury. (Ref)
Conversely, modest alcohol consumption appears to protect against some cancers and diabetes.
Alcohol also causes foetal alcohol spectrum disorder, the leading cause of preventable birth defects and developmental disabilities, the most severe form of which is foetal alcohol syndrome. This is not covered in this article.
Men are particularly vulnerable, with alcohol accounting for 6.7% of potential years of life lost (YLL) due to alcohol, compared to women at 3.5%. In men traumatic injury is the clearly dominant contributor, while in women it’s breast cancer. (Ref – BTW, this is an excellent interactive database)

Years of life lost (YLL) due to alcohol in Australian men and women. Source: Australian Institute of Health and Welfare. (Ref )
Cancer
Alcohol has a causal role in the development of cancers of the mouth, pharynx, larynx, oesophagus, liver, colorectum and breast and an association with stomach and pancreatic cancers. (Ref) For most of these cancers, any alcohol increases risk and beer wine and spirits all similarly impact risk. (Ref) There is however an apparent inverse association between light alcohol consumption (1-2 drink/day) and the risk of kidney cancer, thyroid cancer and lymphoma. (Ref, Ref, Ref, Ref, Ref, Ref)
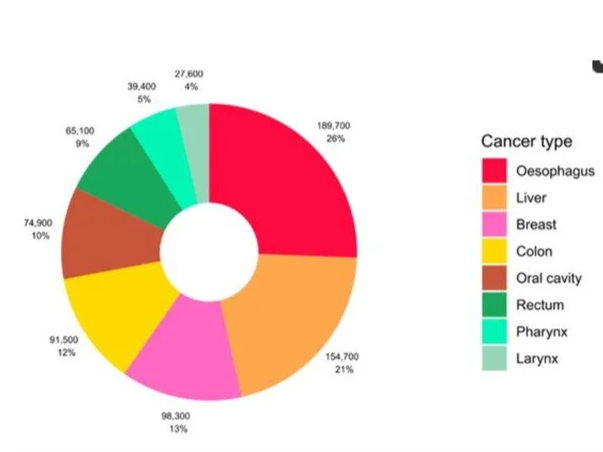
The global number and proportion alcohol-attributable cancer cases by type. Rumgay et al (2021). (Ref)
Below we see the relative risks of different types of cancers at different habitual daily alcohol intakes. Using cancer of the oral cavity for example, a 10g increment of habitual daily alcohol intake, increases risk by an observed 15% and the 95% confidence interval (indicated by the whiskers), denotes a 95% degree of confidence that that the underlying real risk (not necessarily the same as the observed risk) lies between 9% and 22%. If the confidence interval does not include 1.00 (indicative of, in this case, risk in non-drinkers), then the result is said to be statistically significant. For more on statistical techniques see CAYA’s explainer here.

The dose-response relationship for the risk of cancer at different sites per 10 g/day increase in alcohol consumption. Source of relative risk estimates: WCRF Continuous Update Project. RR = Relative risk; CI = Confidence interval. * Non-linear dose-response observed indicating threshold effect. Source: Rumgay et al (2021). (Ref)
For context, cancer, caused 28% of all Australian deaths in 2023, with the largest contributors charted below. Hence, we see that alcohol significantly increases the risk of a several cancers and several of these contribute significantly to over all deaths from cancer in Australia.

Australian cancer deaths ranked by type (2022). Source: Australian Government, Cancer in Australia. (Ref)
But it’s clear from the chart below that risk does not increase linearly and that oesophageal cancer is the only type substantially increased (statistically speaking) even by light drinking. Generally, this is in line with the assertion of the Australian guidelines that risk with light alcohol intake is minimal.
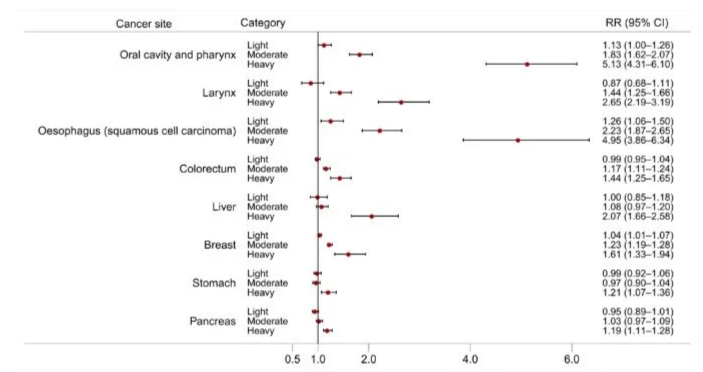
The dose-response relationship for the risk of cancer at different sites with light (≤ 12.5 g/day), moderate (12.5-50 g/day), and heavy (>50 g/day) alcohol intake. Source: Rumgay et al (2021). (Ref)

The progression of liver disease. Alcohol intake and comorbid factors synergistically promote ALD progression. (Ref)
Toxic overwhelm of the liver cells is the primary mechanism, facilitated by suppressed immune cell function and disruption of the health of the gut microbiome likely also plays a role. (Ref) Although not a major site of alcohol metabolism, a similar process may play out in the pancreas. (Ref) The chart below shows the relationship between advanced liver disease and habitual alcohol intake over eight years in a Finnish population who had early metabolic dysfunction-associated fatty liver disease* at the start of the period. You can see an apparent dip around 10g per day, a pattern observable with many other alcohol related conditions too. There is some evidence this is not necessarily due to 10g/day of alcohol being better than 5 or 15g, but rather than it correlates with other healthy behaviours that are insufficiently accounted for. More on this below.
*Metabolic dysfunction-associated fatty liver disease (MAFLD), or non-alcoholic fatty liver disease (NAFLD) pre-rebrand, is not a niche risk factor as it affects about a third of adults worldwide. (Ref)

The observed relationship between alcohol intake and advanced liver disease in a Finnish cohort, with the 95% confidence interval indicated by the respective blue and pink shaded areas. Source Aberg et al. (2020). (Ref)
Cardiovascular disease (CVD)
It’s a generally held (and reassuring) understanding that low level alcohol intake is protective against CVD. Indeed, population studies generally find light to moderate drinking is linked to reduced CVD, mostly mediated through lower atherosclerosis, but also possibly lower blood pressure. However, beyond moderate drinking, cardiovascular risks begin to rise due to increased incidence of alcoholic cardiomyopathy, hypertension, arrhythmias, haemorrhagic stroke and, probably, ischaemic stroke. (Ref) Here’s an example of the much-cited J-shaped curve below.

The J-shaped relationship between alcohol intake and CVD as indicated by blood pressure and coronary artery disease. The yellow data has been adjusted for confounding factors, which here include smoking, body mass index, red meat intake, vegetable intake, physical activity, and self-reported health. The whiskers indicate a 95% confidence interval. Source: Biddinger et al. (2022). (Ref)
However, some argue that the healthy lifestyle factors than tend to accompany low level drinking may fully account for this benefit. Of course, studies attempt to adjust for these factors (known as confounding factors) and they may include diet quality, exercise, waist circumference, socioeconomic status etc. You can see the figure above included smoking, body mass index, red meat intake, vegetable intake, physical activity, and self-reported health. However, genetic studies (referred to as Mendelian randomisation - a brief explainer here on this intriguing method) suggest CVD increases with any drinking and that lifestyle studies merely haven’t uncovered and/or adjusted for all confounders. (Ref) Here’s he same chart comparing alcohol intake relationship with blood pressure and coronary artery disease, but instead using Mendelian Randomisation. No J-shaped curve is evident here.

Here’s another analysis using Mendelian Randomisation in the same UK population, with the shaded areas representing the 95% confidence interval. Here there is no level of alcohol intake that’s less-risky than none. Source: Biddinger et al. (2022). (Ref)
Type 2 diabetes (T2D)
A systematic review looking at population alcohol intake over time and its relationship with type 2 diabetes (T2D) found a U-shaped relationship, with greatest protective effect at 24g/day and 22 g/d of alcohol for women and men, respectively, shown below. (Ref) Another, more recent review found wine was the only type of alcoholic drink that appeared to offer protection, with beer and spirits generally neutral and low to moderate doses. (Ref) One mechanism proposed for the benefit may lie with the improved insulin sensitivity induced by alcohol. (Ref)

Relative risk of diabetes with different habitual daily alcohol intakes in A. Women and B. Men. The dotted lines denote the 95% confidence interval. Source: Baliunas et al (2009). (Ref)
Mendelian Randomisation agrees that the low point of risk is not scratch, indicating 0-14g/week of alcohol is protective - considerably less than the 22-24g/day observed above. This is shown in the chart below, as is a Mendelian analysis for obesity, showing alcohol intakes also appear to cause obesity*. (Ref) This latter relationship has been elusive in observational studies to date, which perplexed everybody as alcohol is calorie dense and lowers food restraint. (Ref) It’s likely confounders are at work again in observational studies. A positive relationship between alcohol and obesity provides one possible underlying mechanism for increased T2D risk with alcohol, as Mendelian Randomisation has also demonstrated a causal relationship between abdominal obesity and hyperglycaemia and the two are very commonly observed together. (Ref)
*Another benefit of Mendelian Randomisation is that it can provide evidence for causality, which is often difficult with observational studies.

The relationship between alcohol intake and obesity and T2D. Here, 1 drink = 14g, so 14 drinks is nearly 20 Australian standard drinks/week. Source: Lu et al (2023). (Ref)
Brain and neurological damage
General intelligence:
Adolescents who drink heavily have been found to have detectable brain changes on MRI and perform less well on cognitive tests. With the brain not completing development until the mid-20s, it’s unfortunate that young adults are also the group most likely to drink to excess. (Ref)
Mental health
Similarly, alcohol can precipitate or exacerbate a range of mental health conditions including anxiety and depression, yet people with sub-optimal mental health are also more likely to use alcohol, creating a negative feedback loop. (Ref) A Drinkwise survey found 26% of drinkers said their mental health had been impacted by their alcohol consumption. (Ref)
Dementia
As with CVD and T2D, observational studies have found low-moderate alcohol consumption is linked to lower rates of dementia, suggesting a protective effect. This is not surprising as heart disease is a predictive factor for cognitive impairment and dementia, with underlying systemic inflammation contributing to both conditions and compromised cerebral blood flow from CVD further increasing risk. (Ref)

Another J-curve: The observed association between alcohol and dementia. Adjusted for age, area, socioeconomic status, education, and APOE ε4 allele. The shading indicates the 95% confidence interval. Note that the association in women is not statistically significant, indicated by a p-value >0.05. Source: Zheng et al (2024). (Ref)
Therefore, it’s also not surprising that, as with CVD, there is a disconnect between population studies which show a protective effect of low levels of alcohol intake (at least in men) and Mendelian randomisation studies which suggest that any such effect is an artefact of incomplete lifestyle factor adjustment. (Ref)

But when Mendelian randomisation is carried out on the same population, the curve shows no protective effect from alcohol. However, here the increase in risk with increasing alcohol intake is only significant in women but not in men, again indicated by the p-values. Source: Zheng et al (2024). (Ref)
Injury
As you will have observed if you live in society, alcohol causes dose-related impacts on risk-taking behaviour, cognitive performance, judgement, self-restraint and physical co-ordination. (Ref) Young adults under 25 are at increased risk from alcohol’s harms, stemming not just from increased traumatic injury risk but also from long-term health risks, particularly to the brain which doesn’t complete development until about age 25. (Ref)
But it’s not just the young, disease-related years of potential life lost (YLL) due to alcohol peaks in the 65-85 year-old age-group, injury-related YLL is highest in 35-45 year-olds. (Ref)

Proportion of Australian injuries caused by alcohol. DALY: Disability adjusted life years
But let’s take a broader perspective. Less alcohol would make us all safer on the roads and as pedestrians and there would be significantly fewer suicides, drownings, poisonings and falls. (Ref) Here’s what happened when alcohol was banned in South Africa a few years ago.
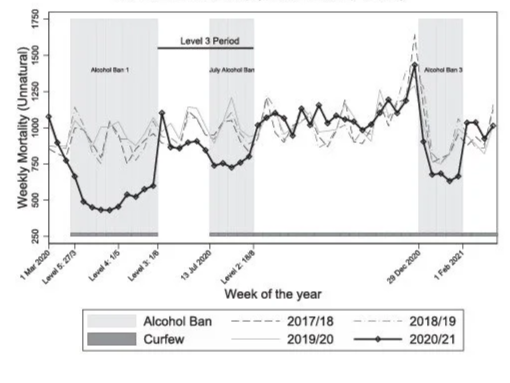
COVID-era alcohol prohibition in South Africa, saw sharp declines in lethal traumatic injuries. Barron et all (2024). (Ref)
It’s hard to see restrictions around alcohol increasing anytime soon. The recent gambling ad ban tussles shows the power of lobby groups even when the ban was overwhelmingly supported by the public. (Ref) While banning drugs merely fuels organised crime, as we have seen with tobacco. (Ref) But parents do influence their children both in word and deed, so perhaps then this is where we can best make a difference. (Ref) As for yourself, circling back to the question at the beginning of the article, there are marginal health benefits to low-level alcohol intake perhaps for T2D, kidney cancer, thyroid cancers and lymphoma, other than that, the evidence suggests any alcohol is harmful. The risks from low-level drinking do however seem less than many other activities of daily life, but if you don’t want to roll the dice, or, if you have one sip, you invariably have a bottle, perhaps then you might consider joining the growing throng of born-again Australian abstainers and redecorate your drinks cupboard with something less medicinal.